
Final Second Creek TMDL Pathogens (fecal coliform)
AL06030002-1204-103
Final
Total Maximum Daily Load
for
Second Creek
Waterbody ID# AL06030002-1204-103
Pathogens (fecal coliform)
Alabama Department of Environmental Management
Water Quality Branch
Water Division
December 2006
Prepared by ADEM/Water Quality Branch Page 1/22
Final Second Creek TMDL Pathogens (fecal coliform)
AL06030002-1204-103
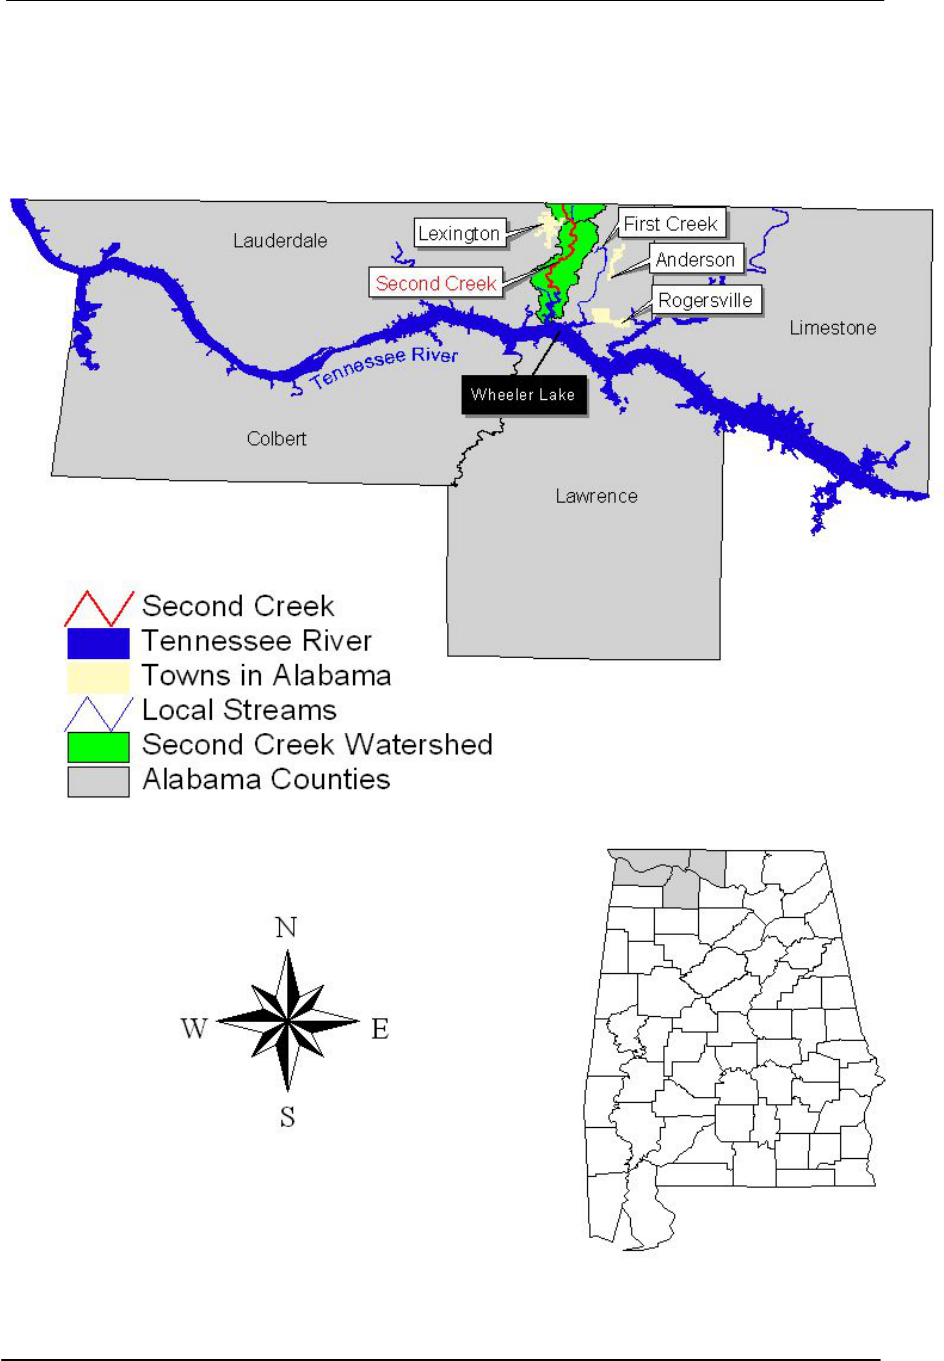
Figure 1: 303(d) Listed Segment of Second Creek
Prepared by ADEM/Water Quality Branch Page 2/22

Final Second Creek TMDL Pathogens (fecal coliform)
AL06030002-1204-103
Table of Contents Page
1.0 Executive Summary 4
2.0 Basis for §303(d) Listing 6
2.1 Introduction 6
2.2 Problem Definition 6
3.0 Technical Basis for TMDL 9
3.1 Water Quality Target Identification 9
3.2 Source Assessment 9
3.3 Landuse 9
3.4 Linkage Between Numeric Targets and Sources 12
3.5 Data Availability and Analysis 12
3.6 Critical Conditions 13
3.7 Margin of Safety 14
4.0 TMDL Development 14
4.1 Definition of a TMDL 14
4.2 Load Calculations 14
4.3 TMDL Summary 16
5.0 Follow Up Monitoring 17
6.0 Public Participation 17
Appendices
A. References 18
B. Water Quality Data 19
List of Figures
Figure 1: 303(d) Listed Segments of Second Creek 2
Figure 3.1: Landuse Map of the Second Creek Watershed 10
Figure 3.2: Sampling Stations in the Second Creek Watershed 13
List of Tables
Table 1.1: Current/Allowable Loads and Required Reductions 5
Table 1.2: TMDL for Second Creek 5
Table 2.1: Geometric Mean Fecal Coliform Violations 8
Table 3.1: Landuse in the Second Creek Watershed 11
Table 3.2: Sampling Station Location Descriptions 12
Table 4.1: Current vs. Allowable Pathogen Loadings for
Second Creek 15
Table 4.2: Current/Allowable Loads and Required Reductions 20
Table 4.3: TMDL Pathogen Loadings 20
Table 5.1: ADEM’s Major River Basin Schedule 21
Prepared by ADEM/Water Quality Branch Page 3/22

Final Second Creek TMDL Pathogens (fecal coliform)
AL06030002-1204-103
1.0 Executive Summary
Section 303(d) of the Clean Water Act and EPA’s Water Quality Planning and Management
Regulations (40 CFR Part 130) require states to identify waterbodies which are not meeting their
designated use(s) and to determine the Total Maximum Daily Load (TMDL) for pollutants
causing the use impairment. A TMDL is the sum of individual waste load allocations for point
sources (WLAs), load allocations (LAs) for nonpoint sources including natural background
levels, and a margin of safety (MOS).
Second Creek is on Alabama’s 303(d) list for pathogens (fecal coliform) from Lauderdale
County Road 76 to the Alabama/Tennessee state line. The listed portion of Second Creek has a
designated use classification of Fish and Wildlife (F&W) from US Highway 72 to the
Alabama/Tennessee state line. Second Creek is a part of the Upper Tennessee River Basin and
begins in Tennessee and flows into Alabama near the town of Lexington and continues on to
Wheeler Lake on the Tennessee River. The USGS hydrologic unit code (HUC) for Wheeler Lake
is 06030002. The Second Creek watershed is comprised of the upper and lower Second Creek
subwatersheds. The HUC numeric ID for the upper and lower Second Creek subwatershed is
06030002-1203 and 06030002-1204, respectively. The total drainage area of the Second Creek
watershed including the portion in the state of Tennessee is approximately 59.0 square miles.
Almost a third of the watershed (33.6%) lies within the state of Tennessee.
Second Creek was placed on the Alabama’s §303(d) list for pathogens in 1998 based on a study
conducted by TVA in 1997. The data used for the listing was gathered from TVA station 10118-
1 and can be found in Appendix B.
TVA collected data monthly at Station 10118-1 in 1997 from June through October. ADEM
collected data on Second Creek at Station SCDL-11 once in July 1998. More recently, ADEM
has collected data on Second Creek at Stations SCDL-11, SCDL-12, and SCDL-13 five times
during the month of June and five times during the month of August in 2003. In 2004, ADEM
has collected data on Second Creek at Stations SCDL-11, SCDL-12, and SCDL-13 five times
during the month of July and five times during the month of September. It should also be noted
that TVA station 10118-1 is the same as ADEM station SCDL-11.
Based on the data from 2003 and 2004, Second Creek is not meeting the pathogen criteria
applicable to its use classification of Fish and Wildlife. Therefore, this TMDL is being developed
for Second Creek.
A mass balance approach was used to calculate this TMDL which utilizes the conservation of
mass principle. The pathogen loading to Second Creek was calculated using a geometric mean
exceedance concentration times the average flow for the 5 samples used to calculate the
geometric mean. The allowable loading was calculated using the same average flow value times
the fecal coliform geometric mean criterion target of 180 colonies/100 mL (200 colonies/100 mL
– 10% Margin of Safety). Reductions to meet the allowable loading were then calculated by
subtracting the allowable loading from the current loading. Table 1.1 is a summary of current
loads, allowable loads and required load reductions necessary to meet the applicable water
Prepared by ADEM/Water Quality Branch Page 4/22

Final Second Creek TMDL Pathogens (fecal coliform)
AL06030002-1204-103
quality pathogen geometric mean criterion for Second Creek. Table 1.2 lists the required TMDL
pathogen loadings under critical conditions for Second Creek.
Table 1.1 Current/Allowable Loads and Required Reductions
Source
Current
Load
(col/day)
Allowable
Load
(col/day)
Required
Reduction
(col/day)
Reduction
%
Final
Load
(col/day)
LA
1.83E+11 1.08E+11 7.55E+10 41% 1.08E+11
WLA
0.00E+00 0.00E+00 0.00E+00 0% 0.00E+00
Table 1.2 TMDL for Second Creek
TMDL
(col/day)
WLA
(col/day)
LA
(col/day)
MOS
(col/day)
1.20E+11 0.00E+00 1.08E+11 1.20E+10
The majority of the watershed is undeveloped and consists of agriculture and forest landuse. The
most likely sources of impairment to the stream come from agricultural landuse. This watershed
has an uncommonly high concentration of agricultural uses accounting for slightly over half of
the landuse (54.6%).
ADEM, in cooperation with other stakeholders, will need to verify the likely sources of fecal
coliform located within the watershed. The likely areas where mitigation efforts will need to
occur will be pastures that contain dense sources of livestock that have direct access to Second
Creek or pasture areas that lie adjacent to the streams that have little to no best management
practices (BMPs) in place. Following identification of these and other landuse issues within the
Alabama portion of the watershed, ADEM will need to coordinate with TDEC in order to
determine the possible pathogen sources in Tennessee. Based on results of these studies, the two
agencies will need to generate a plan that can produce the overall needed reduction in fecal
coliform using BMPs.
Prepared by ADEM/Water Quality Branch Page 5/22

Final Second Creek TMDL Pathogens (fecal coliform)
AL06030002-1204-103
2.0 Basis for §303(d) Listing
2.1 Introduction
Section 303(d) of the Clean Water Act and EPA’s Water Quality Planning and Management
Regulations (40 CFR Part 130) require states to identify waterbodies which are not meeting their
designated uses and to determine the total maximum daily load (TMDL) for pollutants causing
use impairment. The TMDL process establishes the allowable loading of pollutants for a
waterbody based on the relationship between pollution sources and instream water quality
conditions, so that states can establish water-quality based controls to reduce pollution and
restore and maintain the quality of their water resources (USEPA, 1991).
As previously mentioned, Second Creek was placed on the Alabama’s §303(d) list for pathogens
in 1998 based on a study done by TVA in 1997. In the TVA study, there were two out of the
five samples collected that exceeded the maximum single sample criterion of 2000 col/100 ml. It
should be noted that during the 1997 sampling did not provide enough data within the specified
timeframe to calculate a geometric mean. The data collected for the study mentioned above can
be found in Appendix B.
2.2 Problem Definition
Waterbody Impaired: Second Creek from Lauderdale County
Road 76 to the Alabama/Tennessee state line
Waterbody length: 13 miles
Waterbody drainage area: 59 square miles
Water Quality Criterion Violation: Pathogens (in the form of fecal coliform)
(single sample and geometric mean)
Pollutant of Concern: Pathogens (fecal coliform)
Water Use Classification: Fish & Wildlife (F&W)
Usage related to classification:
The impaired stream segments, Second Creek, are classified as F&W. Usage of waters in this
classification are described in ADEM Admin. Code R. 335-6-10-.09(5)(a), (b), (c), (d), and (e) as
follows:
(a) Best usage of waters: fishing, propagation of fish, aquatic life, and wildlife, and
any other usage except for swimming and water-contact sports or as a source of
water supply for drinking or food-processing purposes.
Prepared by ADEM/Water Quality Branch Page 6/22

Final Second Creek TMDL Pathogens (fecal coliform)
AL06030002-1204-103
(b) Conditions related to best usage: the waters will be suitable for fish, aquatic life
and wildlife propagation. The quality of salt and estuarine waters to which this
classification is assigned will also be suitable for the propagation of shrimp and
crabs
(c) Other usage of waters: it is recognized that the waters may be used for incidental
water contact and recreation during June through September, except that water
contact is strongly discouraged in the vicinity of discharges or other conditions
beyond the control of the Department or the Alabama Department of Public
Health.
(d) Conditions related to other usage: the waters, under proper sanitary supervision
by the controlling health authorities, will meet accepted standards of water
quality for outdoor swimming places and will be considered satisfactory for
swimming and other whole body water-contact sports.
(e) Specific Criteria
Fecal Coliform Criteria:
Criteria for acceptable bacteria levels for the Fish and Wildlife use classification are described in
ADEM Admin. Code R. 335-6-10-.09(5)(e)7.(i) and (ii) as follows:
7. Bacteria:
(i) In non-coastal waters, bacteria of the fecal coliform group shall not exceed a
geometric mean of 1,000 colonies/100 mL; nor exceed a maximum of 2,000
colonies/100 mL in any sample. In coastal waters, bacteria of the enterococci
group shall not exceed a maximum of 275 colonies/100 mL in any sample. The
geometric mean shall be calculated from no less than five samples collected at a
given station over a 30-day period at intervals not less than 24 hours.
(ii) For incidental water contact and recreation during June through September, the
bacterial quality of water is acceptable when a sanitary survey by the controlling
health authorities reveals no source of dangerous pollution and when the
geometric mean fecal coliform organism density does not exceed 200
colonies/100 mL in non-coastal waters. In coastal waters, bacteria of the
enterococci group shall not exceed a geometric mean of 35 colonies/100 mL nor
exceed a maximum of 158 colonies/100 mL in any sample. The geometric mean
shall be calculated from no less than five samples collected at a given station over
a 30-day period at intervals not less than 24 hours. When the geometric bacterial
coliform organism density exceeds these levels, the bacterial water quality shall
be considered acceptable only if a second detailed sanitary survey and evaluation
discloses no significant public health risk in the use of the waters. Waters in the
immediate vicinity of discharges of sewage or other wastes likely to contain
bacteria harmful to humans, regardless of the degree of treatment afforded these
Prepared by ADEM/Water Quality Branch Page 7/22

Final Second Creek TMDL Pathogens (fecal coliform)
AL06030002-1204-103
wastes, are not acceptable for swimming or other whole body water-contact
sports.
Criteria Exceeded:
There have been no single sample violations, yet several geometric mean violations for fecal
coliform for the data collected from 2003 through 2004. More specifically, Second Creek had
three events where it exceeded the geometric mean criterion of 200 col/100 ml. Summary table
2.1 and 2.2 document all violations from ADEM’s 2003-2004 sampling event. The single sample
violations did not account for 10% or more of the samples collected, therefore, the TMDL
calculations will be based on the highest geometric mean violation.
Table 2.1 Geometric Mean Fecal Coliform Violations
Station_ID Date
Stream
Flow
(cfs)
Fecal
Coliform
(col/100ml)
Geometric Mean
Summer
Geometric Mean
Criterion of 200
col/100mL
SCDL-11 8/14/2003 34.5 144
8/18/2003 41.3 132
8/20/2003 46.4 124
8/25/2003 38 780
8/26/2003 14.5 610
257 EXCEEDANCE
SCDL-12 6/4/2003 -- 190
6/11/2003 21.8 220
6/18/2003 19.9 175
6/24/2003 25.9 270
6/26/2003 19.2 700
268 EXCEEDANCE
8/14/2003 27.3 212
8/18/2003 31.9 300
8/20/2003 320
8/25/2003 21.5 750
8/26/2003 17.3 176
306 EXCEEDANCE
Prepared by ADEM/Water Quality Branch Page 8/22

Final Second Creek TMDL Pathogens (fecal coliform)
AL06030002-1204-103
3.0 Technical Basis for TMDL
3.1 Water Quality Target Identification
For the purpose of this TMDL a geometric mean fecal coliform target of 180 colonies/100
mL will be used. This target was derived by using a 10% explicit margin of safety from
the geometric mean of 200 colonies/100 mL criterion. This target should not allow the
geometric mean of 200 colonies/100 mL or the single sample maximum of 2000
colonies/100 mL to be exceeded.
3.2 Source Assessment
Point Sources in the Second Creek Watershed:
There are no point sources in the Second Creek watershed. In addition, the Alabama
portion of the Second Creek watershed does not presently qualify as a municipal separate
stormwater sewer system (MS4) area as defined as an urban area serving 50,000 residents
or greater. Therefore, the WLA portion of the TMDL will be zero. Any new discharges to
this stream must meet a geometric mean discharge limit of 200 colonies/100 mL and an
instantaneous maximum limit of 2000 colonies/100 mL for fecal coliform.
Nonpoint Sources in the Second Creek Watershed:
The landuse in the Second Creek watershed is predominately forest and agriculture. On a
site visit on February 18, 2004 to the watershed there were many livestock and horses
observed. The following are examples of how different landuses can contribute to fecal
coliform bacterial loading:
• Agricultural land is commonly a large source of fecal coliform bacteria. Pasture land
runoff, animal operations, improper land application of animal waste, and animals
with access to streams are all contributing factors of fecal coliform bacteria to water
bodies. Agricultural land accounts for half of the landuse in the Second Creek
watershed.
• Fecal coliform bacteria can also originate from forested areas due to the presence of
wild animals such as deer, raccoons, turkeys, waterfowl, etc.
• Leaking septic systems can be another source of fecal coliform bacteria.
The nature and extent of fecal coliform bacterial sources in the watershed will be better
identified during the implementation phase of the TMDL.
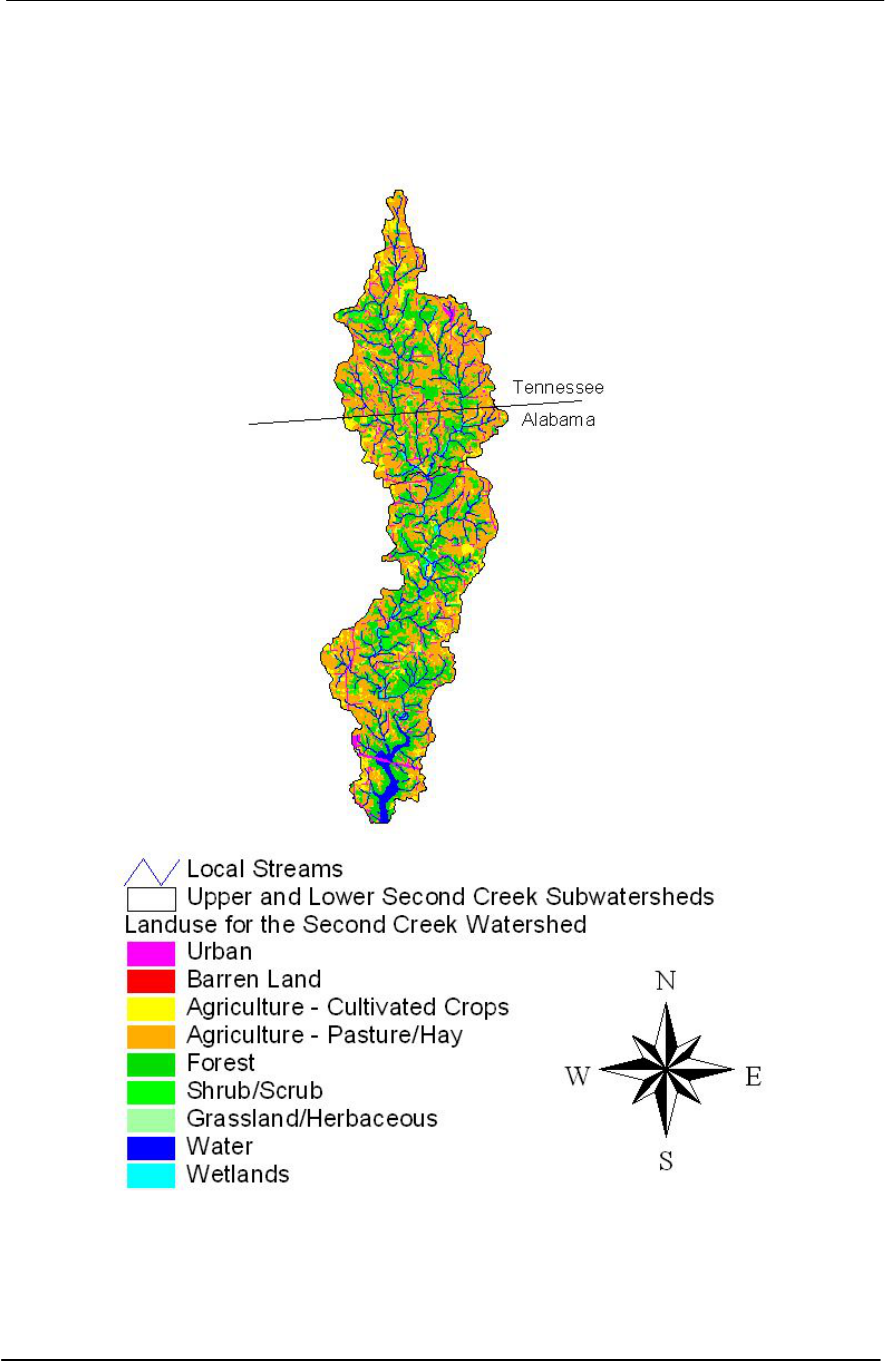
3.3 Landuse
Table 3.1 on the next page provides the various landuses (and their associated
percentages) for the Second Creek watershed. Figure 3.1 is a map of landuse within the
Second Creek watershed. The Tennessee portion of the watershed is 33.6% of the total
area and comprises 20.6% of the total agricultural landuse of the entire Second Creek
watershed. Land use for the Second Creek watershed was determined using ArcView with
land use datasets from 2001. Land use information for this assessment was derived from
the 2001 National Land Cover Dataset (NLCD).
Prepared by ADEM/Water Quality Branch Page 9/22
Final Second Cree
AL
Prepared by
k TMDL Pathogens (fecal coliform)
06030002-1204-103
ADEM/Water Quality Branch Page 10/22
Figure 3.1 Landuse Map of the Second Creek Watershed
Final Second Cree
AL
Prepared by
k TMDL Pathogens (fecal coliform)
06030002-1204-103
ADEM/Water Quality Branch Page 11/22
Table 3.1 Landuse in the Second Creek Watershed
acres
mi
2
% acres
mi
2
% acres
mi
2
%
Open Water 621.1 1.0 2.5 2.0 0.0 0.0 623.1 1.0 1.6
Developed, Open Space 1257.0 2.0 5.0 715.4 1.1 5.6 1972.4 3.1 5.2
Developed, Low Intensity 96.5 0.2 0.4 27.8 0.0 0.2 124.3 0.2 0.3
Developed, Medium Intensity 8.0 0.0 0.0 1.3 0.0 0.0 9.3 0.0 0.0
Barren Land (Rock/Sand/Clay
)
0.0 0.0 0.0 2.7 0.0 0.0 2.7 0.0 0.0
Deciduous Forest 6565.5 10.3 26.2 2487.0 3.9 19.6 9052.5 14.1 24.0
Evergreen Forest 603.4 0.9 2.4 362.9 0.6 2.9 966.3 1.5 2.6
Mixed Forest 1261.6 2.0 5.0 498.8 0.8 3.9 1760.5 2.8 4.7
Shrub/Scrub 1044.4 1.6 4.2 672.7 1.1 5.3 1717.1 2.7 4.5
Grassland/Herbaceous 195.3 0.3 0.8 62.7 0.1 0.5 258.0 0.4 0.7
Pasture/Hay 11033.0 17.2 44.0 6908.7 10.8 54.3 17941.6 28.0 47.5
Cultivated Crops 1816.1 2.8 7.2 874.9 1.4 6.9 2691.0 4.2 7.1
Woody Wetlands 569.8 0.9 2.3 95.2 0.1 0.7 665.0 1.0 1.8
Total 25071.6 39.2 100.0 12712.3 19.9 100.0 37783.8 59.0 100.0
Agriculture 12849.0 20.1 51.2 7783.6 12.2 61.2 20632.6 32.2 54.6
Forest 9000.3 14.1 35.9 3444.0 5.4 27.1 12444.3 19.4 32.9
Developed 1361.5 2.1 5.4 744.6 1.2 5.9 2106.1 3.3 5.6
Other 1860.8 2.9 7.4 740.1 1.2 5.8 2600.9 4.1 6.9
Total 25071.6 39.2 100.0 12712.3 19.9 100.0 37783.8 59.0 100.0
Combined Watersheds
Second Creek Watershed
Land Cover
Alabama Tennessee

Final Second Creek TMDL Pathogens (fecal coliform)
AL06030002-1204-103
3.4 Linkage between Numeric Targets and Sources
It is envisioned that sources will be better defined during actual implementation. As can
be seen from viewing the above table, Second Creek has two major landuses – forest and
agriculture. Pollutant loadings from forested areas tend to be low due to their filtering
capabilities. Observation of the landuses within the Second Creek watershed indicates
agricultural areas as being the likely sources of fecal coliform bacteria. However, since
the impaired segment consists of such a large drainage area, (59.0 square miles) with
diverse land cover/uses, it was not considered practicable to determine individual
components of nonpoint source (NPS) loading. As such, individual loads or reductions for
various sources such as forest, agriculture, and septic systems will not be specified.
Loadings and reductions will only be viewed as a total NPS load.
3.5 Data Availability and Analysis
There have been three main studies in this watershed for relevant chemical data. The first
study was performed by TVA in 1997. Of the five stations in this study, station 10118-1
recorded two samples that exceeded the single sample criterion and placed Second Creek
on the §303(d) list in 1998 for fecal coliform. The second study was performed by ADEM
in which only one sample was collected on Second Creek at Station SCDL-11 in July
1998 which was below the single sample criterion of 2000 col/100 ml.
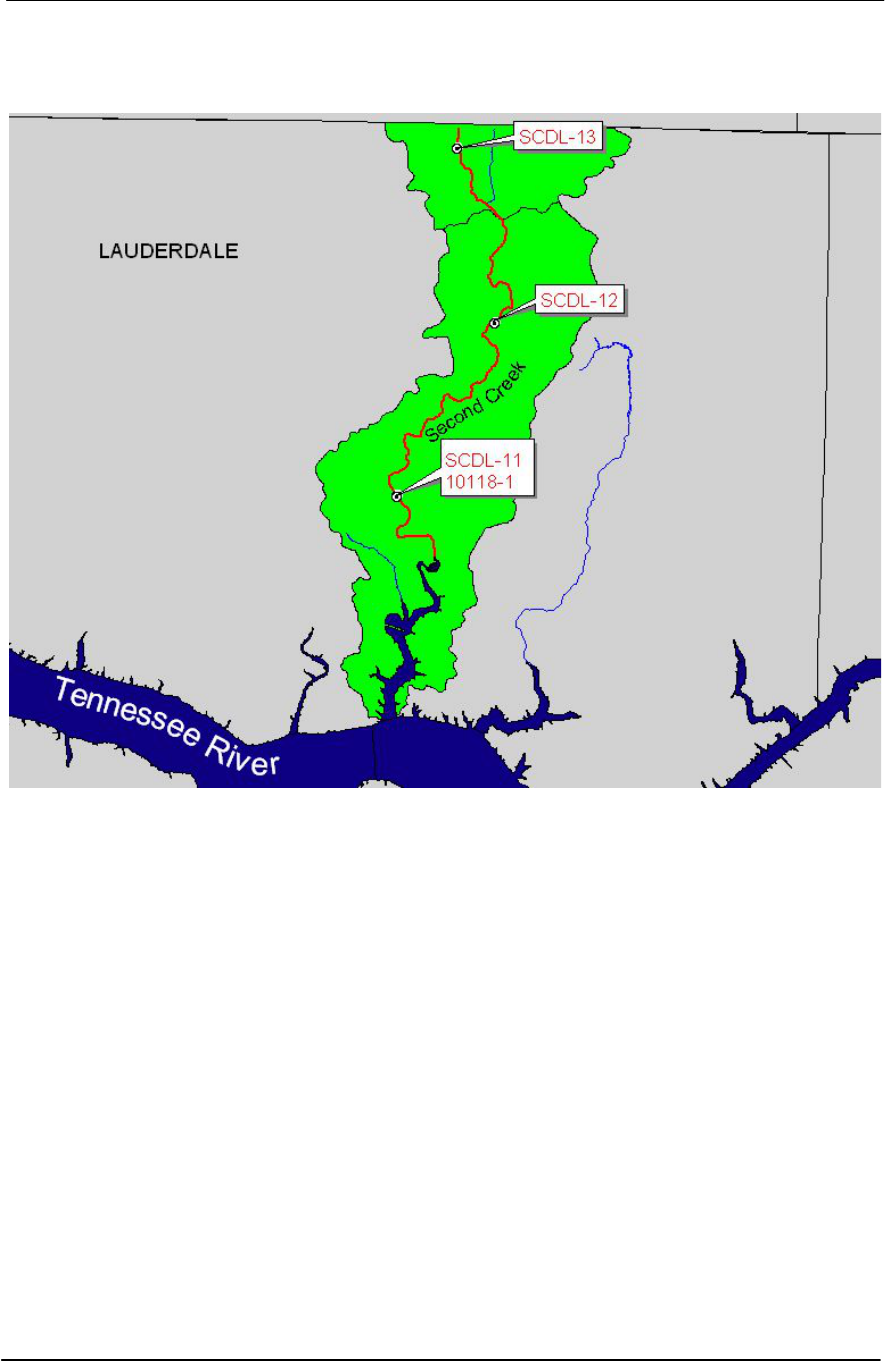
The third study was performed by ADEM in 2003 and 2004 in which §303(d) sampling
occurred at three stations on Second Creek at stations SCDL-11, SCDL-12, and SCDL-13.
The stations collectively produced 59 samples that were adequate for geometric mean
calculations and single sample analysis. Station SCDL-11 had one violation and SCDL-
12 had two violations exceeding the geometric mean water quality criterion of 200 col/100
ml for fecal coliform. When comparing the data to the single sample criterion of 2000
col/100 ml, there were no violations. The data for the stations mentioned above can be
found in Appendix B. Sample locations are shown in Figure 3.2. Location descriptions
for all stations can be found in Table 3.2. It should also be noted that TVA station 10118-
1 is the same as ADEM station SCDL-11.
Table 3.2 Sampling Station Location Descriptions
Year
Station
ID Data Source Station Location Latitude Longitude
1997
10118-1
TVA
1998 ADEM - NPS
2003 &
2004
SCDL-11
ADEM -
303(d)
Second Creek @ Lauderdale
County Road 76
34.8854 -87.3734
2003 &
2004
SCDL-12
ADEM -
303(d)
Second Creek @ Lauderdale
County Road 88
34.9395 -87.3368
2003 &
2004
SCDL-13
ADEM -
303(d)
Second Creek @ Lauderdale
County Road 489
34.9939 -87.3509
Prepared by ADEM/Water Quality Branch Page 12/22
Final Second Creek TMDL Pathogens (fecal coliform)
AL06030002-1204-103
Figure 3.2 Sampling Stations in the Second Creek Watershed
3.6 Critical Conditions
The summer months are generally considered critical conditions. In the summer, periods
of dry weather interspersed with thunderstorms allow for the accumulation and washing
off of fecal coliform bacteria into streams. These summer trends result in spikes of fecal
coliform bacteria counts. Winter trends show frequent low intensity rain events that do
not allow for the build-up of fecal coliform bacteria on the land surface, resulting in a
more uniform loading rate. The summer fecal coliform criterion is more stringent than the
winter criterion.
The Second Creek watershed follows both the trends described above for the summer
months and winter months. Table 2.1 and 2.2 show that the higher concentrations of fecal
coliform occur at high flows and low flows. The maximum geometric mean concentration
of 306 colonies/100 mL with an average flow of 24.5 cfs at SCDL-12 will be used to
estimate the TMDL pathogen loadings to Second Creek under critical conditions.
Prepared by ADEM/Water Quality Branch Page 13/22

Final Second Creek TMDL Pathogens (fecal coliform)
AL06030002-1204-103
3.7 Margin of Safety (MOS)
There are two methods for incorporating a MOS in the analysis: 1) implicitly incorporate
the MOS using conservative model assumptions to develop allocations, or 2) by explicitly
specifying a portion of the TMDL as the MOS. An explicit MOS was incorporated in this
TMDL and was applied by reducing the target criterion concentration by ten percent.
Thus, the geometric mean criterion was reduced by ten percent to achieve a target
concentration of 180 colonies/100 ml, which yields a MOS equal to 20 colonies/100 ml.
4.0 TMDL Development
4.1 Definition of a TMDL
A total maximum daily load (TMDL) is the sum of individual waste load allocations for
point sources (WLAs), load allocations (LAs) for nonpoint sources including natural
background levels, and a margin of safety (MOS). The margin of safety can be included
either explicitly or implicitly and accounts for the uncertainty in the relationship between
pollutant loads and the quality of the receiving waterbody. As discussed earlier, the MOS
is explicit in this TMDL. A TMDL can be denoted by the equation:
TMDL = Σ WLAs + Σ LAs + MOS
The TMDL is the total amount of pollutant that can be assimilated by the receiving
waterbody while achieving water quality standards under critical conditions.
For some pollutants, TMDLs are expressed on a mass loading basis (e.g. pounds per day).
However, for pathogens, TMDL loads are typically expressed in terms of organism counts
per day (col/day), in accordance with 40 CFR 130.2(i).
4.2 Load Calculations
A mass balance approach was used to calculate the TMDL for Second Creek which
utilizes the conservation of mass principle. The pathogen loading to Second Creek was
calculated using a geometric mean exceedance concentration times the average flow for
the 5 samples used to calculate the geometric mean.
Two loads were calculated in this analysis. The first was to estimate current pathogen
loads to the watershed during a violation event. It was done by multiplying a geometric
mean exceedance concentration of 306 col/100 ml times the average measured flow. This
concentration was measured at SCDL-12 in August of 2003 and can be found in Appendix
B. The average measured flow for this event was 24.5 cfs. The product of these two
values and a conversion factor gives the loading to the watershed under exceedance
conditions. The second load represents the allowable value to the watershed under the
same physical conditions as the first. This is done by taking the product of the same flow
Prepared by ADEM/Water Quality Branch Page 14/22

Final Second Creek TMDL Pathogens (fecal coliform)
AL06030002-1204-103
times the conversion factor times the allowable fecal concentration of 180 col/100 mL.
The difference between these two loads, converted to a percent reduction, represents the
loading reduction necessary to achieve the water quality criterion for fecal coliform under
critical conditions. Calculations for these two loads can be found below in Table 4.1.
Table 4.1 Current vs. Allowable Pathogen Loadings for Second Creek
Average Flow measured at SCDL-12 for Geometric Mean Samples: 24.5 cfs
Geometric Mean Fecal coliform concentration measured: 306 col/100 mL
Allowable fecal coliform maximum concentration minus MOS: 180 col/100mL = 200 - 10%
Margin of saftey for the maximum criteria 20 col/100mL = 10% of criteria
Load Calculations:
Load = Fecal Coliform Conc * Measured Flow * Conversion Factor
Load = colonies of Fecal Coliform/day Measured Flow = cfs
Fecal Coliform Conc = colonies/100 mL Conversion Factor = 24468984 (ml-s/ft3-day)
Current Load:
Nonpoint source load (LA) 1.83E+11 colonies/day
Point source load (WLA) 0.00E+00 colonies/day There are no point sources in this watershed
Current load = 1.83E+11 colonies/day
Allowable Load:
Nonpoint source load (LA) 1.08E+11 colonies/day
Point source load (WLA) 0.00E+00 colonies/day There are no point sources in this watershed
Allowable load = 1.08E+11 colonies/day
Margin of Saftey:
MOS load = 1.20E+10 colonies/day
Source
Current Load
(col/day)
Allowable
Load
(col/day)
Required
Reduction
(col/day) Reduction %
Final Load
(col/day)
LA 1.83E+11 1.08E+11 7.55E+10 41% 1.08E+11
WLA 0.00E+00 0.00E+00 0.00E+00 0% 0.00E+00
Total 1.83E+11 1.08E+11 7.55E+10 41% 1.08E+11
Total Maximum Daily Load (TMDL):
TMDL = WLA + LA + MOS
TMDL WLA LA MOS
1.20E+11 0.00E+00 1.08E+11 1.20E+10
Percent Reduction to Achieve the Fecal Coliform Criterion:
Total reduction: 41% = (current load - allowable load) / current load
The following assumptions are made for calculating the allowable load.
The water quality criterion for fecal coliform for summer geomtric means is 200 col/100 mL.
To account for an explicit Margin of Safety (MOS) a target concentration of 180 col/100 ml was
used to calculate the allowable load compared to the maximum criterion which = 200 – 10%
Prepared by ADEM/Water Quality Branch Page 15/22

Final Second Creek TMDL Pathogens (fecal coliform)
AL06030002-1204-103
4.3 TMDL Summary
Regulations require states to identify waterbodies which are not meeting their designated
use and to determine the Total Maximum Daily Load (TMDL) for pollutants causing the
use impairment. A TMDL is the sum of individual waste load allocations for point sources
(WLAs), load allocations (LAs) for nonpoint sources including natural background levels,
and a margin of safety (MOS).
Based on ADEM’s 2003 & 2004 sampling events, the violations of geometric mean
criterion at two of the three stations in the watershed make it evident that Second Creek is
impaired for fecal coliform. The fecal coliform violations in this watershed were relatively
moderate in number and concentration with the highest geometric mean concentrations at
306 col/100 ml which is approximately one and a half times the geometric mean fecal
coliform criterion of 200 col/100 ml.
A mass balance approach was used to calculate the TMDL. Table 4.1 is a summary of
current loads, allowable loads and required load reductions necessary to meet the
applicable water quality pathogen geometric mean criterion for Second Creek. Table 4.2
lists the required TMDL pathogen loadings under critical conditions for Second Creek.
Table 4.2 Current/Allowable Loads and Required Reductions
Source
Current
Load
(col/day)
Allowable
Load
(col/day)
Required
Reduction
(col/day)
Reduction
%
Final
Load
(col/day)
LA
1.83E+11 1.08E+11 7.55E+10 41% 1.08E+11
WLA
0.00E+00 0.00E+00 0.00E+00 0% 0.00E+00
Table 4.3 TMDL for Second Creek
TMDL
(col/day)
WLA
(col/day)
LA
(col/day)
MOS
(col/day)
1.20E+11 0.00E+00 1.08E+11 1.20E+10
The most likely source of fecal coliform in this watershed is activities associated with
agricultural landuse (i.e. pasture/hay). Of the 59 square miles of watershed, 32.2 square
miles are designated as agricultural lands, which is just over half of the entire watershed.
High agricultural use is common in the Tennessee basin. Based on USGS’s 2001 NLCD,
the portion of the Second Creek watershed in the state of Tennessee has an agricultural
land cover equal to 61.2% and the portion of the Second Creek watershed in the state of
Alabama, specifically Lauderdale County, is 51.2% agriculture. Combined, the total
landuse for the Second Creek watershed is more than half (54.6%) agriculture.
ADEM, in cooperation with other stakeholders, will need to verify the likely sources of
fecal coliform located within the watershed. The likely areas where mitigation efforts will
need to occur will be pastures that contain dense sources of livestock that have direct
access to Second Creek or pasture areas that lie adjacent to the streams that have little to
Prepared by ADEM/Water Quality Branch Page 16/22

Final Second Creek TMDL Pathogens (fecal coliform)
AL06030002-1204-103
no best management practices (BMPs) in place. Following identification of these and
other landuse issues within the Alabama portion of the watershed, ADEM will need to
coordinate with TDEC in order to determine the possible pathogen sources in Tennessee.
Based on results of these studies, the two agencies will need to generate a plan that can
produce the overall needed reduction in fecal coliform using BMPs.
5.0 Follow Up Monitoring
ADEM has adopted a basin approach to water quality management; an approach that
divides Alabama’s fourteen major river basins into five groups. Each year, the ADEM
water quality resources are concentrated in one of the five basin groups. One goal is to
continue to routinely monitor §303(d) listed waters until such waters are meeting their
designated uses. Monitoring will help further characterize water quality conditions
resulting from the implementation of best management practices in the watershed. This
monitoring will occur in each basin according to the schedule shown in Table 5-1.
Table 5.1 ADEM’s Major River Basin Monitoring Schedule
River Basin Group Year to be Monitored
Escatawpa / Mobile / Lower Tombigbee / Upper Tombigbee 2006
Black Warrior / Cahaba 2007
Tennessee 2008
Chattahoochee / Chipola / Choctawhatchee / Perdido-Escambia 2009
Alabama / Coosa / Tallapoosa 2010
6.0 Public Participation
As part of the public participation process, this TMDL was placed on public notice and
made available for review and comment. The public notice was prepared and published in
the four major daily newspapers in Montgomery, Huntsville, Birmingham, and Mobile, as
well as submitted to persons who have requested to be on ADEM’s postal and electronic
mailing distributions. In addition, the public notice and subject TMDL was made
available on ADEM’s Website: www.adem.state.al.us. The public can also request paper
or electronic copies of the TMDL by contacting Mr. Chris Johnson at 334-271-7827 or
[email protected]. The public was given an opportunity to review the TMDL and
submit comments to the Department in writing. At the end of the public review period, all
written comments received during the public notice period became part of the
administrative record. ADEM considered all comments received by the public prior to
finalization of this TMDL and subsequent submission to EPA Region 4 for final review
and approval.
Prepared by ADEM/Water Quality Branch Page 17/22

Final Second Creek TMDL Pathogens (fecal coliform)
AL06030002-1204-103
Appendix A
References
Alabama Department of Environmental Management (ADEM), Alabama’s Water Quality
Assessment and Listing Methodology, December 2005.
Alabama Department of Environmental Management’s 303(d) Monitoring Program. 2001-
2002.
ADEM Administrative Code, 2002. Water Quality Program, Chapter 335-6-10, Water
Quality Criteria, and Chapter 335-6-11 Use Classifications for Interstate and Intrastate
Waters.
United States Environmental Protection Agency. 1991. Guidance for Water Quality-Based
Decisions: The TMDL Process, Office of Water, EPA 440/4-91-001.
USEPA. 2001. Protocol for Developing Pathogen TMDLs. EPA 841-R-00-001. U.S.
Environmental Protection Agency, Office of Water, Washington DC.
Prepared by ADEM/Water Quality Branch Page 18/22

Final Second Creek TMDL Pathogens (fecal coliform)
AL06030002-1204-103
Appendix B
Water Quality Data
Table B.1 Pathogen & Flow Data Collected by TVA on Second Creek (1997)
Station #
Stream
Name
Date
(yymmdd)
Time
(24 hr)
Stream
Flow
(cfs)
Fecal Coliform
(col/100ml)
10118-1 Second Cr 970609 1100 457 3200
10118-1 Second Cr 970708 1100 63.2 55
10118-1 Second Cr 970812 1100 23.3 1820
10118-1 Second Cr 970909 1045 20.1 1940
10118-1 Second Cr 971014 1030 39.3 2860
Table B.2 Pathogen & Flow Data Collected by ADEM on Second Creek (1998)
Station #
Date
(yymmdd)
Time
(24 hr)
Stream
Flow
(cfs)
Fecal Coliform
(col/100ml)
SCDL-011 980722 0955 28.5 350
Prepared by ADEM/Water Quality Branch Page 19/22

Final Second Creek TMDL Pathogens (fecal coliform)
AL06030002-1204-103
Table B.3 Pathogen & Flow Data Collected by ADEM on Second Creek at Station
SCDL-11 (2003 & 2004)
Station
ID Date
Stream
Flow (cfs)
Fecal Coliform
(col/100ml)
Geometric Mean
(col/100ml)
6/4/2003 77.8 67
6/11/2003 20.9 212
6/18/2003 23.8 220
6/24/2003 35.8 260
6/26/2003 15.1 390
200
8/14/2003 34.5 144
8/18/2003 41.3 132
8/20/2003 46.4 124
8/25/2003 38 780
8/26/2003 14.5 610
257
7/12/2004 43.4 73
7/13/2004 64.1 112
7/14/2004 62 76
7/19/2004 8.8 100
7/20/2004 36.5 57
81
9/14/2004 27.9 200
9/20/2004 42.3 60
9/23/2004 49.7 88
9/27/2004 28.7 124
SCDL-11
9/29/2004 24.3 78
100
Prepared by ADEM/Water Quality Branch Page 20/22

Final Second Creek TMDL Pathogens (fecal coliform)
AL06030002-1204-103
Table B.4 Pathogen & Flow Data Collected by ADEM on Second Creek at Station
SCDL-12 (2003 & 2004)
Station ID Date
Stream
Flow (cfs)
Fecal Coliform
(col/100ml)
Geometric Mean
(col/100ml)
6/4/2003 -- 190
6/11/2003 21.8 220
6/18/2003 19.9 175
6/24/2003 25.9 270
6/26/2003 19.2 700
268
8/14/2003 27.3 212
8/18/2003 31.9 300
8/20/2003 -- 320
8/25/2003 21.5 750
8/26/2003 17.3 176
306
7/12/2004 -- 120
7/13/2004 -- 232
7/14/2004 -- 92
7/19/2004 26.6 132
7/20/2004 27.1 232
151
9/14/2004 15.8 140
9/20/2004 49.4 135
9/23/2004 30.9 160
9/27/2004 18.6 148
SCDL-12
9/29/2004 19.7 270
165
Prepared by ADEM/Water Quality Branch Page 21/22

Final Second Creek TMDL Pathogens (fecal coliform)
AL06030002-1204-103
Table B.5 Pathogen & Flow Data Collected by ADEM on Second Creek at Station
SCDL-13 (2003 & 2004)
Station ID Date
Stream
Flow
(cfs)
Fecal Coliform
(col/100ml)
Geometric
Mean
(col/100ml)
6/4/2003 7.6 67
6/11/2003 10.7 152
6/18/2003 8.3 94
6/24/2003 8.1 116
6/26/2003 6.1 152
111
8/14/2003 10.7 --
8/18/2003 15.6 180
8/20/2003 13.5 132
8/25/2003 9.3 104
8/26/2003 8.7 490
n/a
7/12/2004 17.3 120
7/13/2004 15.6 220
7/14/2004 14 88
7/19/2004 36 37
7/20/2004 11.3 49
84
9/14/2004 4.9 116
9/20/2004 17.8 105
9/23/2004 10.8 156
9/27/2004 7.6 100
SCDL-13
9/29/2004 9.2 160
125
Prepared by ADEM/Water Quality Branch Page 22/22
